February 2024 real estate statistics: minto, mapleton and wellington north
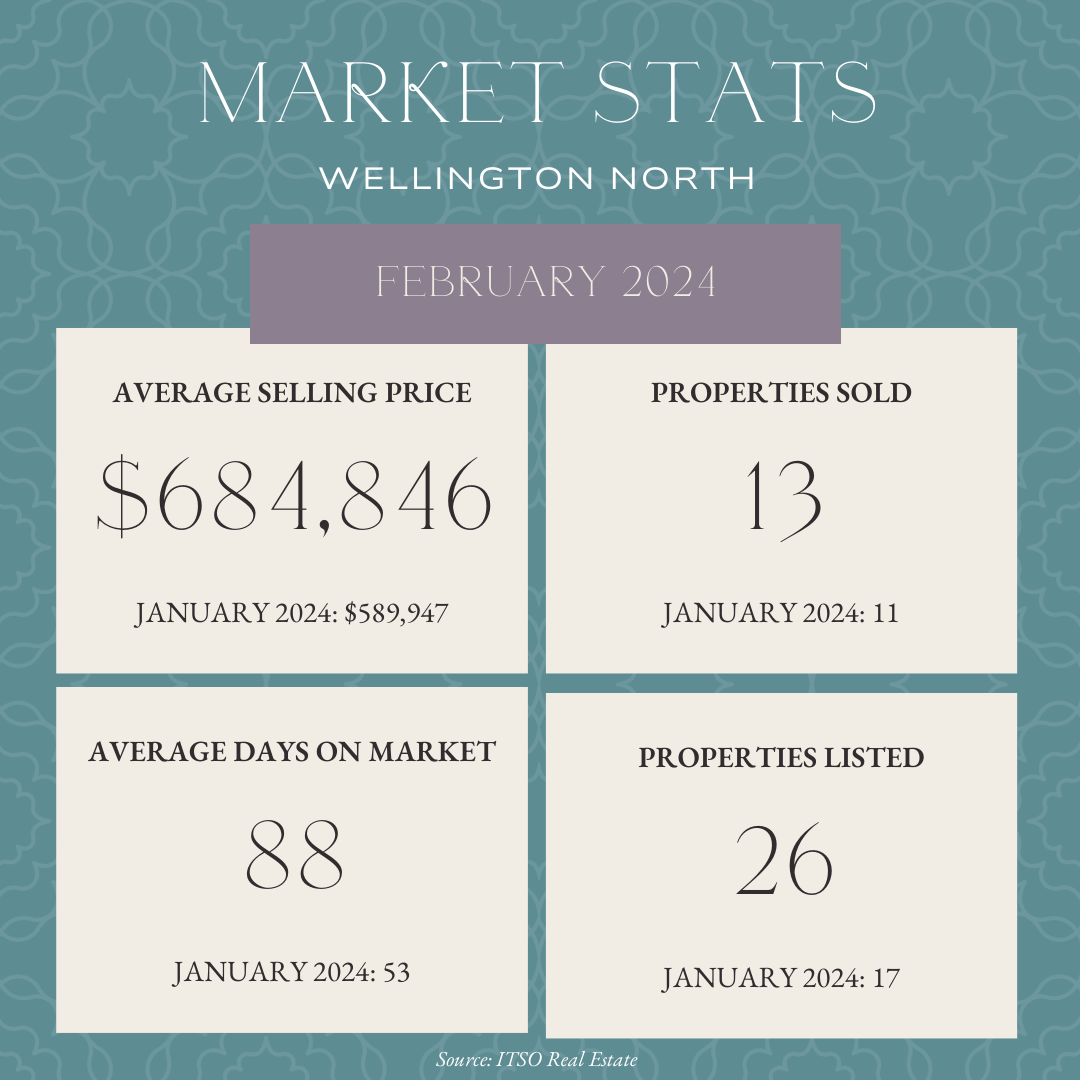
The numbers for February 2024 are in! I have broken the numbers down by township. The corresponding numbers for January 2024 are listed in smaller print for comparison. The average selling price for all 3 townships is up compared to January. As you can see Mapleton is still maintaining a high average selling price but ,like the other 2 townships, has a very low volume of sold properties. All 3 townships are up with respect to number of listed properties compared to January which isn’t surprising as January tends to be a quiet month. The Average Days on Market for February is much higher in Wellington North than Minto and Mapleton. Again, be careful with average selling prices when the number of sold properties are so low. One very high or very low sale can have a big effect on the average. #listingagent #homeselling #realestategoals #buyer’sagent #buyingahouse #buyingahome #realestatemarket #marketupdate #realestateexpert